Reading a first line chart in five steps
Fill in the blanks · Basic · §1.4 Drawing your first chart
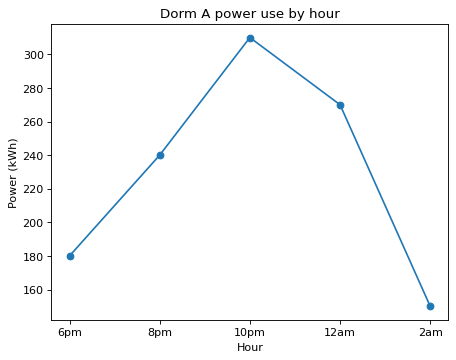
Draw a line chart of Dorm A's power use by hour. Fill in the three blanks to make a place to draw, connect the values with a line, and add the y-axis label.
The finished figure has the title Dorm A power use by hour, the x-axis label Hour, and the y-axis label Power (kWh).
Code with blanks
import matplotlib.pyplot as plt

# 1. Prepare the data
hours = ["6pm", "8pm", "10pm", "12am", "2am"]
kwh = [180, 240, 310, 270, 150]

# 2. Make a place to draw
fig, ax = plt.____
# 3. Draw
ax.____(hours, kwh, marker="o")
# 4. Add labels
ax.set_title("Dorm A power use by hour")
ax.set_xlabel("Hour")
ax.____("Power (kWh)")
# 5. Show
plt.show()
Solve this problem in your browser
Python runs in your browser and checks your answer right away. Hints and the answer are on the problem page.