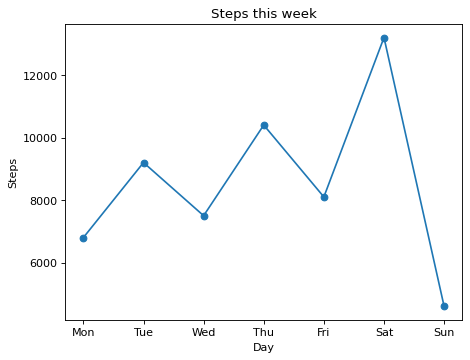
A line chart of steps in a week
Write code · Basic · §1.4 Drawing your first chart
Draw a line chart of daily steps over one week. Put days on the x-axis and steps on the y-axis, and mark each value with a circle marker (marker="o").
Set the title to Steps this week, the x-axis label to Day, and the y-axis label to Steps.
Starter code
import matplotlib.pyplot as plt

days = ["Mon", "Tue", "Wed", "Thu", "Fri", "Sat", "Sun"]
steps = [6800, 9200, 7500, 10400, 8100, 13200, 4600]

# Write your code here
Solve this problem in your browser
Python runs in your browser and checks your answer right away. Hints and the answer are on the problem page.