A chart of bus riders by hour with a custom size
Write code · Medium · §1.4 Drawing your first chart
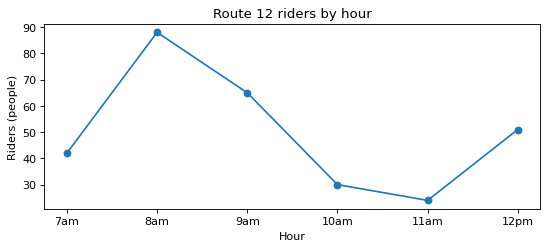
Draw a line chart of riders by hour on bus route 12. Set the figure size to 8 inches wide and 3 inches tall.
The title is Route 12 riders by hour, and the x-axis label is Hour. For the y-axis label, include the unit as well: Riders (people).
Starter code
import matplotlib.pyplot as plt

hours = ["7am", "8am", "9am", "10am", "11am", "12pm"]
riders = [42, 88, 65, 30, 24, 51]

# Write your code here
Solve this problem in your browser
Python runs in your browser and checks your answer right away. Hints and the answer are on the problem page.