Rewriting a seedling chart in the fig, ax style
Write code · Medium · §2.5 Converting code and checking for errors
The starter code draws the weekly height of tomato seedlings planted in the school garden in the plt style and saves it as a PNG. Keep the figure and the saved file the same, and rewrite the code so that it gives commands directly to fig and ax.
Create the Figure and the Axes in one line with fig, ax = plt.subplots(). Set the line, the title, the axis labels, and the y-axis range with ax methods, and save with a fig method. Keep the figure size, the file name seedling.png, and the resolution dpi=100 as they are, and do not add any other arguments when you save. Grading also checks the pixel size of the saved PNG.
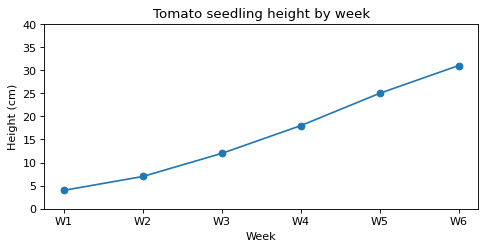
Starter code
import matplotlib.pyplot as plt

weeks = ["W1", "W2", "W3", "W4", "W5", "W6"]
height = [4, 7, 12, 18, 25, 31]

plt.figure(figsize=(7, 3))
plt.plot(weeks, height, marker="o")
plt.title("Tomato seedling height by week")
plt.xlabel("Week")
plt.ylabel("Height (cm)")
plt.ylim(0, 40)
plt.savefig("seedling.png", dpi=100)
plt.show()
Solve this problem in your browser
Python runs in your browser and checks your answer right away. Hints and the answer are on the problem page.