A washer chart with a line style and gridlines
Write code · Medium · §2.4 Finishing and saving a single chart
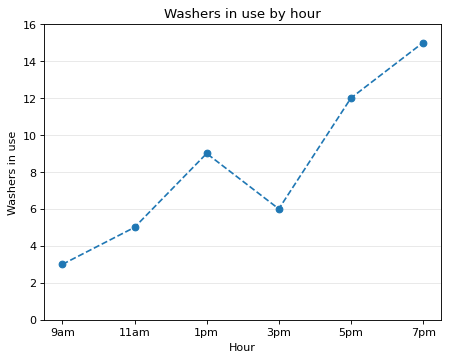
Draw a line chart of how many washers were running at each hour in the campus laundry room. Draw the line as a dashed line ("--"), and mark each value with a circle marker ("o").
Add the title Washers in use by hour, the x-axis label Hour, and the y-axis label Washers in use. The laundry room has 16 washers in all, so make the y-axis run from 0 to 16. Draw horizontal gridlines at the y-axis ticks only.
Starter code
import matplotlib.pyplot as plt

hours = ["9am", "11am", "1pm", "3pm", "5pm", "7pm"]
washers = [3, 5, 9, 6, 12, 15]

# Write your code here
Solve this problem in your browser
Python runs in your browser and checks your answer right away. Hints and the answer are on the problem page.