Checking an AI draft against the request
Code review · Challenge · §3.4 Titles, legends, and layout
You asked an AI for the following and got this code.
"Using the given years, applicants, and ratio lists, draw two line charts by year side by side. The left Axes is the number of applicants to the Computer Science department, and the right Axes is the competition ratio. The two Axes should share only the year axis, with separate y-axis ranges: 0 to 500 applicants, and 0 to 10 for the competition ratio. Give each Axes a title and a y-axis label with units, and make the figure title Computer Science applicants, 2021-2026."
The code runs without errors, but it misses three of the conditions in the request. Compare the request with the code line by line, and fix three lines.
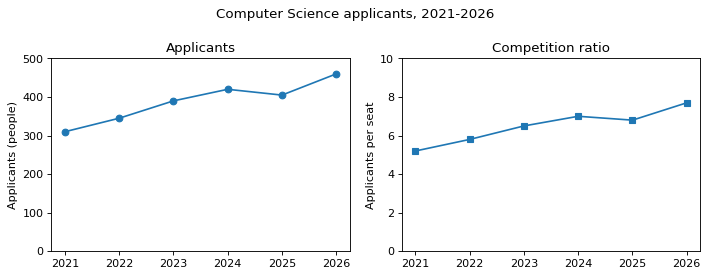
Code to fix
import matplotlib.pyplot as plt

years = ["2021", "2022", "2023", "2024", "2025", "2026"]
applicants = [310, 345, 390, 420, 405, 460]
ratio = [5.2, 5.8, 6.5, 7.0, 6.8, 7.7]

fig, axes = plt.subplots(1, 2, figsize=(9, 3.5))
axes[0].plot(years, applicants, marker="o")
axes[0].set(title="Applicants", ylabel="Applicants (people)", ylim=(0, 500))
axes[1].plot(years, ratio, marker="s")
axes[1].set(title="Competition ratio", ylabel="Applicants per seat", ylim=(0, 100))
plt.title("Computer Science applicants, 2021-2026")
fig.tight_layout()
plt.show()
Solve this problem in your browser
Python runs in your browser and checks your answer right away. Hints and the answer are on the problem page.