A legend only on the Axes with two lines
Write code · Medium · §3.4 Titles, legends, and layout
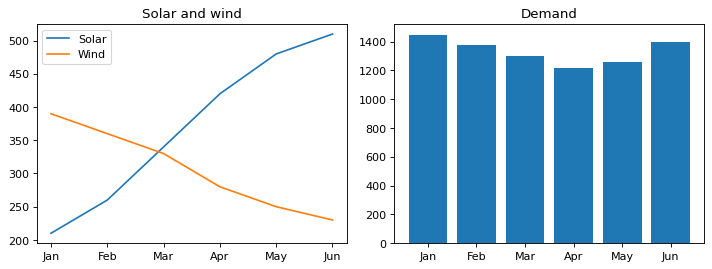
Draw a region's monthly power generation and power demand on Axes in 1 row and 2 columns. On the left Axes, draw two lines, solar power solar first and wind power wind next, label them Solar and Wind, and show a legend. On the right Axes, draw power demand, demand, as a bar chart.
The titles are Solar and wind on the left and Demand on the right. The right Axes has only one set of bars, and its title says what is drawn, so it gets no legend.
Starter code
import matplotlib.pyplot as plt

months = ["Jan", "Feb", "Mar", "Apr", "May", "Jun"]
solar = [210, 260, 340, 420, 480, 510]
wind = [390, 360, 330, 280, 250, 230]
demand = [1450, 1380, 1300, 1220, 1260, 1400]

# Write your code here
Solve this problem in your browser
Python runs in your browser and checks your answer right away. Hints and the answer are on the problem page.