A 2×2 report of a plant's weekly metrics
Write code · Challenge · §3.5 Putting it together and checking for errors
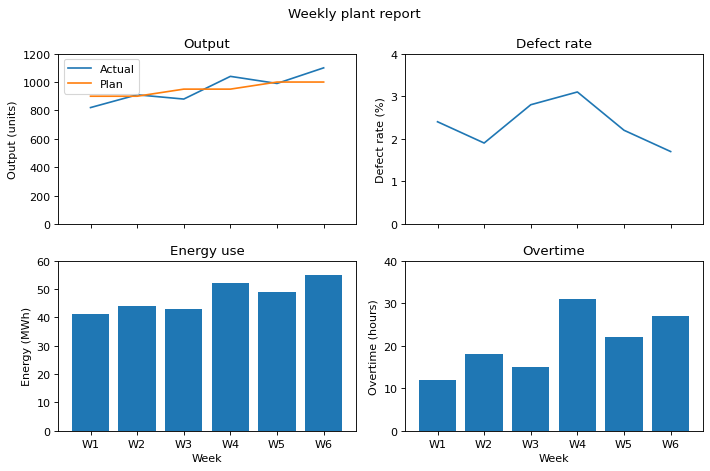
Draw a report figure of a plant's weekly metrics on Axes in 2 rows and 2 columns. Before drawing, you planned what goes on each Axes as follows.
The top left is output. Draw the actual output, output, first and the plan, plan, next as two lines on the same Axes, and add a legend with the labels Actual and Plan. The title is Output, the y-axis label is Output (units), and the y-axis range is 0 to 1200.
The top right is a line chart of the defect rate, defect_rate. The title is Defect rate, the y-axis label is Defect rate (%), and the y-axis range is 0 to 4.
The bottom left is a bar chart of energy use, energy. The title is Energy use, the y-axis label is Energy (MWh), and the y-axis range is 0 to 60.
The bottom right is a bar chart of overtime hours, overtime. The title is Overtime, the y-axis label is Overtime (hours), and the y-axis range is 0 to 40.
The four Axes share the x-axis so that they show the same weeks, and keep separate y-axes. Add the x-axis label Week only to the bottom two Axes, add the figure title Weekly plant report, and then tidy the margins.
Starter code
import matplotlib.pyplot as plt

weeks = ["W1", "W2", "W3", "W4", "W5", "W6"]
output = [820, 910, 880, 1040, 990, 1100]
plan = [900, 900, 950, 950, 1000, 1000]
defect_rate = [2.4, 1.9, 2.8, 3.1, 2.2, 1.7]
energy = [41, 44, 43, 52, 49, 55]
overtime = [12, 18, 15, 31, 22, 27]

# Write your code here
Solve this problem in your browser
Python runs in your browser and checks your answer right away. Hints and the answer are on the problem page.