Saving a figure with a figure title and Axes titles
Write code · Medium · §3.4 Titles, legends, and layout
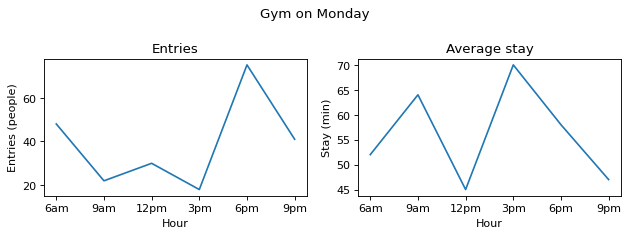
Draw the number of people entering a gym on Monday and their average length of stay, by hour, as line charts on Axes in 1 row and 2 columns. Draw entries on the left Axes and stay on the right Axes.
The figure title is Gym on Monday. The Axes titles are Entries on the left and Average stay on the right. Put units in the y-axis labels: Entries (people) on the left and Stay (min) on the right. The x-axis label on both Axes is Hour.
Make the figure 8 inches wide and 3 inches tall, tidy the margins, and save it as gym_monday.png. When you save, give only the resolution dpi=150, and do not use the setting that trims the outer margins (bbox_inches="tight"). The PNG then comes out 1200 pixels wide and 450 pixels tall.
Starter code
import matplotlib.pyplot as plt

hours = ["6am", "9am", "12pm", "3pm", "6pm", "9pm"]
entries = [48, 22, 30, 18, 75, 41]
stay = [52, 64, 45, 70, 58, 47]

# Write your code here
Solve this problem in your browser
Python runs in your browser and checks your answer right away. Hints and the answer are on the problem page.