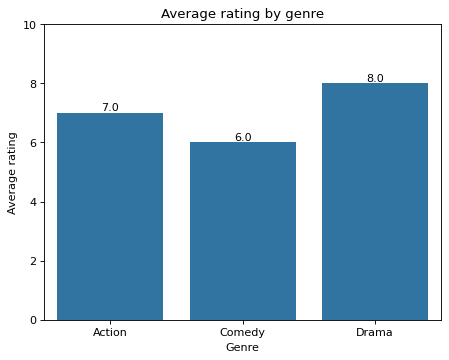
Average rating by genre with error bars turned off
Write code · Medium · §4.2 Color groups and summary values
The DataFrame movies lists movies that students in a class watched, one movie per row, with each movie's genre and rating (out of 10). Draw bars of the average rating by genre with seaborn's barplot(). Put the genre column on the x-axis and the rating column on the y-axis.
Turn off the error bars around the means. On top of each bar, write the mean as a value label with one decimal place (for example, 7.0). Ratings are out of 10, so set the y-axis range to 0 to 10. The title is Average rating by genre, the x-axis label is Genre, and the y-axis label is Average rating.
Starter code
import pandas as pd
import seaborn as sns
import matplotlib.pyplot as plt

genres = ["Action", "Comedy", "Drama"] * 3
ratings = [6, 5, 8, 8, 6, 9, 7, 7, 7]
movies = pd.DataFrame({"genre": genres, "rating": ratings})

# Write your code here
Solve this problem in your browser
Python runs in your browser and checks your answer right away. Hints and the answer are on the problem page.