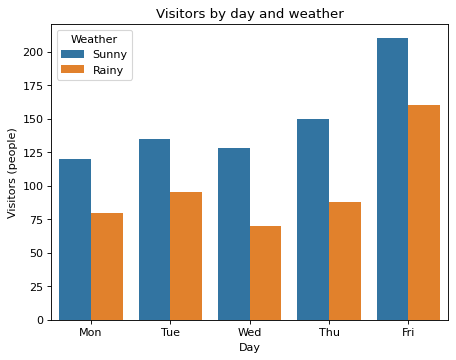
Grouped bars for a sunny week and a rainy week
Write code · Basic · §4.2 Color groups and summary values
A museum put its daily visitor counts for a week of sunny days and a week of rainy days into the long-format DataFrame visits. Draw a grouped bar chart with the sunny-week bar and the rainy-week bar side by side for each day.
In seaborn's barplot(), put the day column on the x-axis and the visitors column on the y-axis, and use hue to split the bars by the values of the weather column. For each day, put the Sunny bar on the left and the Rainy bar on the right. Show which color is which weather with a legend, and set the legend title to Weather.
The title is Visitors by day and weather, the x-axis label is Day, and the y-axis label is Visitors (people).
Starter code
import pandas as pd
import seaborn as sns
import matplotlib.pyplot as plt

days = ["Mon", "Tue", "Wed", "Thu", "Fri"]
sunny = [120, 135, 128, 150, 210]
rainy = [80, 95, 70, 88, 160]
by_weather = pd.DataFrame({"day": days, "Sunny": sunny, "Rainy": rainy})
visits = by_weather.melt(id_vars="day", var_name="weather", value_name="visitors")

# Write your code here
Solve this problem in your browser
Python runs in your browser and checks your answer right away. Hints and the answer are on the problem page.