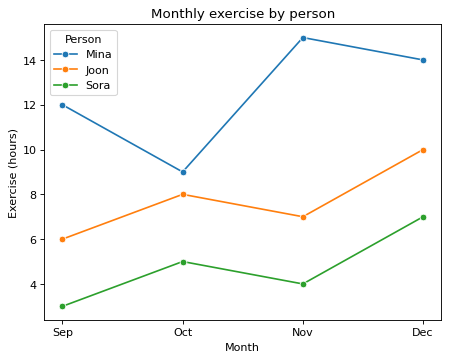
Monthly exercise with one line per person
Write code · Medium · §4.2 Color groups and summary values
The wide-format DataFrame by_person holds how many hours three students exercised each month during one semester. Each person has their own column. Use melt() to turn this DataFrame into a long-format DataFrame with the columns month, person, and hours.
Draw the new DataFrame with seaborn's lineplot(). Put the month column on the x-axis and the hours column on the y-axis, and use hue to draw a separate line for each person. The lines and the legend follow the column order of the DataFrame (Mina, Joon, Sora), so you do not need to reorder them.
Set the chart title to Monthly exercise by person, the x-axis label to Month, the y-axis label to Exercise (hours), and the legend title to Person.
Starter code
import pandas as pd
import seaborn as sns
import matplotlib.pyplot as plt

months = ["Sep", "Oct", "Nov", "Dec"]
mina = [12, 9, 15, 14]
joon = [6, 8, 7, 10]
sora = [3, 5, 4, 7]
by_person = pd.DataFrame({"month": months, "Mina": mina, "Joon": joon, "Sora": sora})

# Write your code here
Solve this problem in your browser
Python runs in your browser and checks your answer right away. Hints and the answer are on the problem page.