A 100% stacked bar chart with a different total each term
Fill in the blanks · Medium · §5.4 Comparing shares and sizes
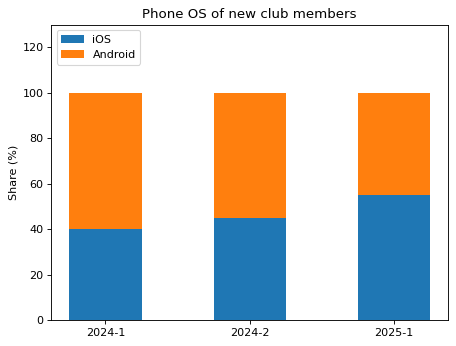
A club surveyed the smartphone operating systems of its new members each term. The number of new members differs by term, so divide the count for each operating system by that term's number of new members to get the share (%), and draw a 100% stacked bar chart.
Stack the iOS bar at the bottom and the Android bar on top of it. Fill in the two blanks to get the number of new members in each term and to set where the Android bar starts (bottom=).
Code with blanks
import pandas as pd
import matplotlib.pyplot as plt

members = pd.DataFrame({
    "term": ["2024-1", "2024-1", "2024-2", "2024-2", "2025-1", "2025-1"],
    "os": ["Android", "iOS"] * 3,
    "people": [42, 28, 33, 27, 36, 44],
})

counts = members.pivot(index="term", columns="os", values="people")
newcomers = ____
ios_share = counts["iOS"] / newcomers * 100
android_share = counts["Android"] / newcomers * 100

fig, ax = plt.subplots()
ax.bar(counts.index, ios_share, width=0.5, label="iOS")
ax.bar(counts.index, android_share, width=0.5, bottom=____, label="Android")
ax.set(title="Phone OS of new club members", ylabel="Share (%)", ylim=(0, 130))
ax.legend(loc="upper left")
plt.show()
Solve this problem in your browser
Python runs in your browser and checks your answer right away. Hints and the answer are on the problem page.