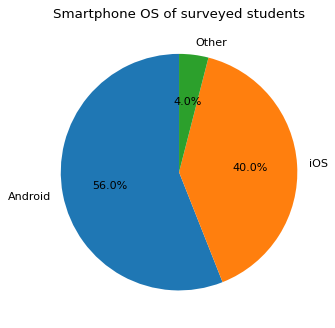
A pie chart of smartphone OS shares
Write code · Basic · §5.4 Comparing shares and sizes
The DataFrame phones holds the number of surveyed students for each smartphone operating system. Each student uses only one operating system, so the parts do not overlap, and together they make up all the respondents. Draw this breakdown as a pie chart.
Draw the slices in the order of the DataFrame, label each slice with its operating system name (os), and write each share to one decimal place with a % sign (for example, 56.0%). Set the title to Smartphone OS of surveyed students.
Starter code
import pandas as pd
import matplotlib.pyplot as plt

phones = pd.DataFrame({
    "os": ["Android", "iOS", "Other"],
    "users": [112, 80, 8],
})

# Write your code here
Solve this problem in your browser
Python runs in your browser and checks your answer right away. Hints and the answer are on the problem page.