A figure title stuck on the last panel
Code review · Medium · §5.3 Facets and returned objects
This code tries to add the figure title App use and satisfaction to a faceted chart split by operating system. It runs without errors, but there is no figure title above the chart, and the right panel's title iOS has been replaced with the figure title text.
Change one line so that the figure title appears above the chart while the panel titles Android and iOS stay as they are.
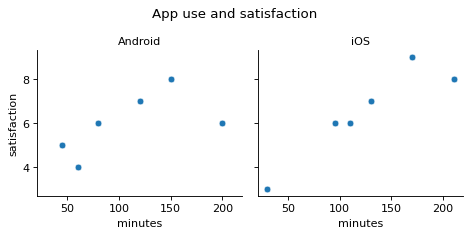
Code to fix
import pandas as pd
import seaborn as sns
import matplotlib.pyplot as plt

survey = pd.DataFrame({
    "minutes": [45, 80, 120, 150, 200, 60, 95, 130, 170, 210, 30, 110],
    "satisfaction": [5, 6, 7, 8, 6, 4, 6, 7, 9, 8, 3, 6],
    "os": ["Android"] * 6 + ["iOS"] * 6,
})

g = sns.relplot(data=survey, x="minutes", y="satisfaction", col="os", kind="scatter", height=3)
g.set_titles("{col_name}")
plt.title("App use and satisfaction")
g.figure.subplots_adjust(top=0.8)
plt.show()
Solve this problem in your browser
Python runs in your browser and checks your answer right away. Hints and the answer are on the problem page.