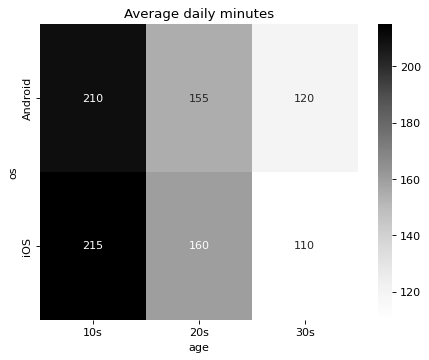
A heatmap of averages by OS and age group
Write code · Challenge · §5.5 Reviewing and reading your chart choice
To check the claim "Android users in their teens use apps the longest," split the daily app usage time (minutes) of 12 respondents by two criteria, operating system (os) and age group (age), and look at the averages.
Use pivot_table() to make a DataFrame of averages with operating systems as rows and age groups as columns, and draw it with seaborn's heatmap(), writing the average in each cell as a whole number (fmt=".0f"). Set the title to Average daily minutes.
Starter code
import pandas as pd
import seaborn as sns
import matplotlib.pyplot as plt

usage = pd.DataFrame({
    "os": ["Android", "iOS"] * 6,
    "age": ["10s"] * 4 + ["20s"] * 4 + ["30s"] * 4,
    "minutes": [190, 210, 230, 220, 150, 170, 160, 150, 110, 120, 130, 100],
})

# Write your code here
Solve this problem in your browser
Python runs in your browser and checks your answer right away. Hints and the answer are on the problem page.