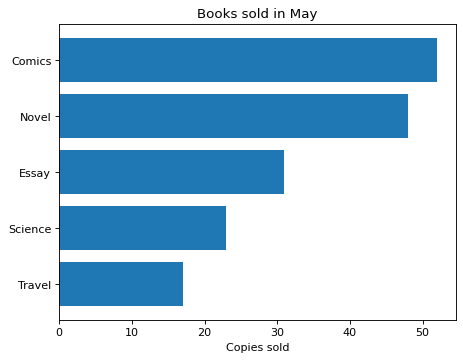
A sorted horizontal bar chart that shows the sales ranking
Write code · Medium · §5.4 Comparing shares and sizes
The DataFrame books holds a bookstore's copies sold by genre in May. Draw the copies sold as a horizontal bar chart, sorted so that the best-selling genre is at the top. Sorting lets readers see the ranking even between genres with a small gap, such as Novel and Comics.
Set the title to Books sold in May and the x-axis label to Copies sold.
Starter code
import pandas as pd
import seaborn as sns
import matplotlib.pyplot as plt

books = pd.DataFrame({
    "genre": ["Novel", "Comics", "Essay", "Travel", "Science"],
    "sold": [48, 52, 31, 17, 23],
})

# Write your code here
Solve this problem in your browser
Python runs in your browser and checks your answer right away. Hints and the answer are on the problem page.