A bar range and a hard-coded annotation flagged in peer review
Code review · Medium · §6.5 The final chart and peer review
A peer polished a bar chart of an online store's return rate by product for this month. When you checked it against the review checklist, two problems came up. First, the y-axis does not start at 0, so the bar lengths are not in proportion to the values. Second, the annotation text and the arrow position are typed in as numbers, so they do not change when you swap in next month's returns.
Change the y-axis range to 0–7. Then find the product with the highest return rate in returns, and fix the annotation so that its text shows the product name and the value, as in Desk 6.2%, and its arrow points to that bar. You can fix it by changing three lines or fewer.
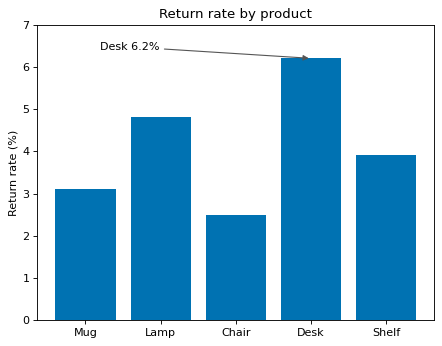
Code to fix
import matplotlib.pyplot as plt

products = ["Mug", "Lamp", "Chair", "Desk", "Shelf"]
returns = [3.1, 4.8, 2.5, 6.2, 3.9]  # return rate this month (%)

fig, ax = plt.subplots()
ax.bar(products, returns, color="#0072B2")
ax.set_ylim(2, 7)
ax.annotate("Desk 6.2%", xy=(3, 6.2), xytext=(0.2, 6.4),
            arrowprops={"arrowstyle": "-|>", "color": "#555555"})
ax.set_title("Return rate by product")
ax.set_ylabel("Return rate (%)")
plt.show()
Solve this problem in your browser
Python runs in your browser and checks your answer right away. Hints and the answer are on the problem page.