Two bar charts with a different summary for each question
Write code · Medium · §7.1 The question and the review order
A customer support center recorded the number of inquiries by channel for four days, Monday to Thursday, in the DataFrame log. Each row of the DataFrame is one day and one channel.
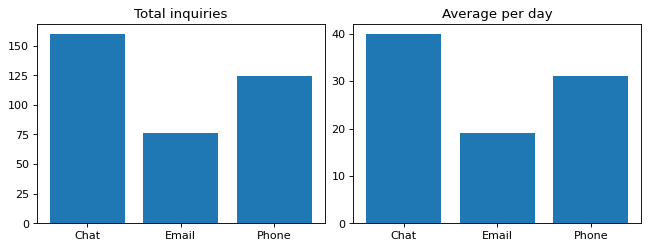
Using the same DataFrame, draw vertical bar charts that answer two questions, on two Axes in 1 row and 2 columns. In both panels, put one bar for each channel, in the order Chat, Email, Phone.
The left Axes answers "How many inquiries did each channel get in total over the four days?" Set its title to Total inquiries.
The right Axes answers "How many inquiries did each channel get per day on average?" Set its title to Average per day.
Starter code
import matplotlib.pyplot as plt
import pandas as pd

days = ["Mon"] * 3 + ["Tue"] * 3 + ["Wed"] * 3 + ["Thu"] * 3
channels = ["Chat", "Email", "Phone"] * 4
inquiries = [42, 18, 30, 36, 24, 33, 45, 15, 27, 37, 19, 34]
log = pd.DataFrame({"day": days, "channel": channels, "inquiries": inquiries})

# Write your code here
Solve this problem in your browser
Python runs in your browser and checks your answer right away. Hints and the answer are on the problem page.