A final chart titled with an observation
Write code · Challenge · §6.5 The final chart and peer review
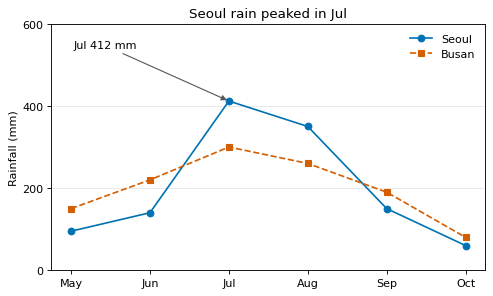
Make a final chart for a report from the May–October rainfall of two cities. Draw Seoul (seoul) first and Busan (busan) next, and take the colors from city_colors. Give Seoul a solid line with circle markers ("o"), and give Busan a dashed line ("--") with square markers ("s"). Show a legend with the labels Seoul and Busan.
Set the y-axis range to 0–600 and place a tick every 200. Draw only horizontal grid lines, at the y-axis ticks, and set the y-axis label to Rainfall (mm).
Add an arrow annotation with the month and the rainfall, as in Jul 412 mm, to the point of the month with the most rain in Seoul. Write the title as an observation that includes that month: Seoul rain peaked in Jul. Calculate the months and values in the annotation and the title from the data, and do not put any other text (such as a source line) inside the chart besides this annotation.
Starter code
import matplotlib.pyplot as plt
from matplotlib.ticker import MultipleLocator

months = ["May", "Jun", "Jul", "Aug", "Sep", "Oct"]
seoul = [95, 140, 412, 350, 150, 60]
busan = [150, 220, 300, 260, 190, 80]
city_colors = {"Seoul": "#0072B2", "Busan": "#D55E00"}

# Write your code here
Solve this problem in your browser
Python runs in your browser and checks your answer right away. Hints and the answer are on the problem page.