Highlighting only the busiest building
Write code · Medium · §6.2 Colors, lines, and markers
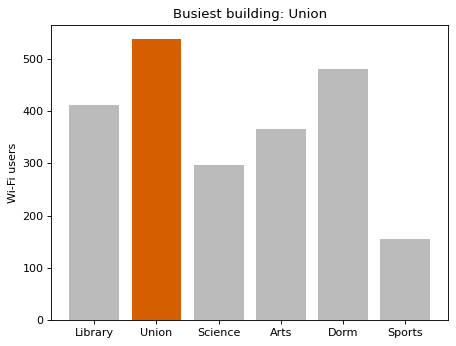
Draw a bar chart of the daily number of Wi-Fi users in each campus building. Draw the bars with Matplotlib's bar(), and place the buildings in the order listed in buildings. Color only the bar of the building with the most users orange #D55E00, and the rest gray #BBBBBB. Compute the list of bar colors from users.
To show why the bar is highlighted, put the name of the busiest building in the title, as in Busiest building: Union. Set the y-axis label to Wi-Fi users.
Starter code
import matplotlib.pyplot as plt

buildings = ["Library", "Union", "Science", "Arts", "Dorm", "Sports"]
users = [412, 538, 297, 365, 480, 156]

# Write your code here
Solve this problem in your browser
Python runs in your browser and checks your answer right away. Hints and the answer are on the problem page.