A title that says total and bars drawn on top of each other
Code review · Basic · §7.1 The question and the review order
A hospital recorded the number of patients each clinic saw from Monday to Wednesday in the DataFrame visits. Each row of the DataFrame is one day and one clinic. The title of the bar chart a colleague drew says it shows the three-day total.
Following the review order in §7.1, first read what the title claims, then check the bar heights against the values in the DataFrame. Change at most two lines so that the bars show the three-day total for each clinic. Keep the title and the y-axis label as they are.
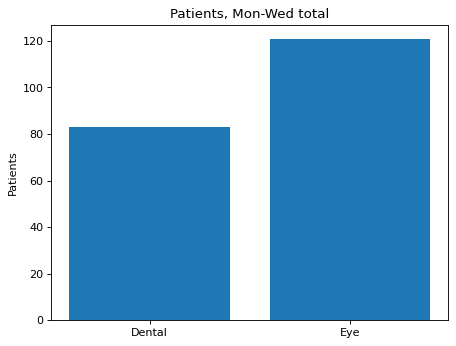
Code to fix
import matplotlib.pyplot as plt
import pandas as pd

days = ["Mon", "Mon", "Tue", "Tue", "Wed", "Wed"]
clinics = ["Dental", "Eye"] * 3
patients = [24, 40, 31, 36, 28, 45]
visits = pd.DataFrame({"day": days, "clinic": clinics, "patients": patients})

fig, ax = plt.subplots()
ax.bar(visits["clinic"], visits["patients"])
ax.set_title("Patients, Mon-Wed total")
ax.set_ylabel("Patients")
plt.show()
Solve this problem in your browser
Python runs in your browser and checks your answer right away. Hints and the answer are on the problem page.