A light horizontal grid behind the bars and tidy spines
Write code · Basic · §7.2 Legends, direct labels, and grids
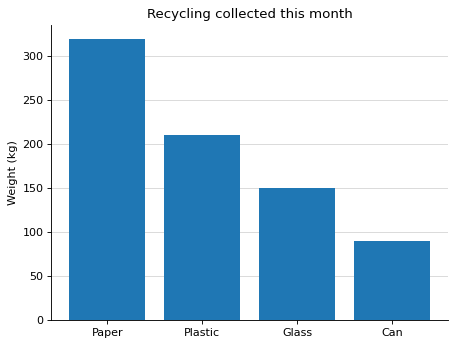
Draw a vertical bar chart of the weight (kg) of recyclables collected on campus this month, by material. Put the bars in the order of materials. The title is Recycling collected this month, and the y-axis label is Weight (kg).
To make the bar heights easy to read, draw only light horizontal grid lines and no vertical grid lines. Put the grid behind the bars with set_axisbelow(True).
Hide the top and right spines, and keep the left and bottom spines, which serve as the reference for the values.
Starter code
import matplotlib.pyplot as plt

materials = ["Paper", "Plastic", "Glass", "Can"]
weights = [320, 210, 150, 90]

# Write your code here
Solve this problem in your browser
Python runs in your browser and checks your answer right away. Hints and the answer are on the problem page.